Resource
Game Warden Salary by State 2026 (BLS Data)
By WardenTools Research Team · Last updated 2026-06
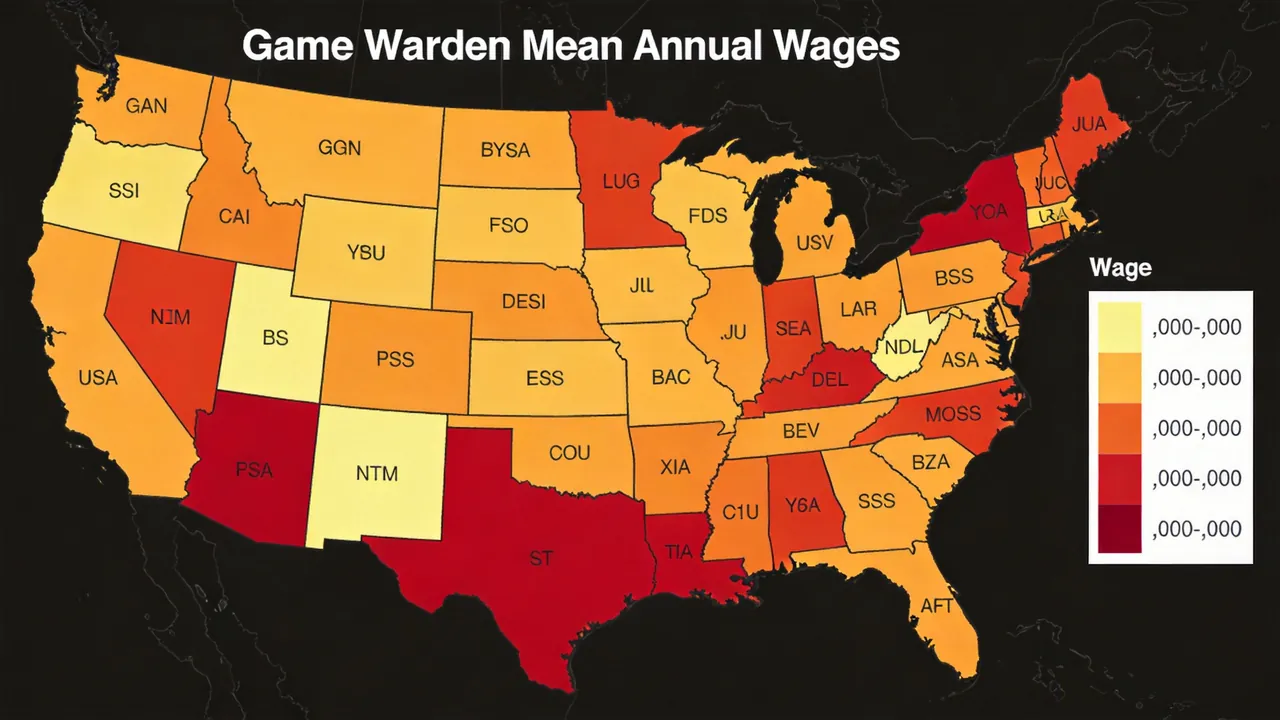
Game warden pay varies more by geography than by almost any other factor. According to the U.S. Bureau of Labor Statistics (BLS) OEWS May 2023 release for SOC 33-3031, state mean wages range from $31,010 in Florida to $89,020 in California — a gap of more than $58,000. This page ranks every state for which BLS separately reports data and explains why some states are absent (small workforce = suppressed for statistical reliability).
Salary data compiled by the WardenTools Research Team from BLS OEWS May 2023 (SOC 33-3031). States without separately-reported BLS data are noted honestly — we do not estimate suppressed figures.
How to Read This Table
The ranking below reflects states for which the BLS separately reports game warden wage data in the May 2023 OEWS release. For each state we list:
- Mean annual wage — the average salary across all reported game wardens in that state
- Mean hourly wage — the average hourly rate
- Employment — the number of game wardens the BLS counts in that state
- vs. national median — the state mean minus the national median ($60,380)
States are ranked by mean annual wage, highest first. The full state-by-state detail — including requirements, academies, and how-to-become steps — is on each state's dedicated page at /state/[state]/.
Game Warden Salary Ranked by State (BLS May 2023)
| Rank | State | Mean annual | Mean hourly | Employment | vs. National median |
|---|---|---|---|---|---|
| 1 | California | $89,020 | $42.80 | 280 | +$28,640 |
| 2 | Minnesota | $88,280 | $42.44 | 140 | +$27,900 |
| 3 | Washington | $82,320 | $39.58 | 100 | +$21,940 |
| 4 | Hawaii | $73,070 | $35.13 | 100 | +$12,690 |
| 5 | New York | $76,060 | $36.57 | 390 | +$15,680 |
| 6 | North Dakota | $75,720 | $36.40 | 30 | +$15,340 |
| 7 | Tennessee | $72,200 | $34.71 | 370 | +$11,820 |
| 8 | Georgia | $68,610 | $32.98 | 50 | +$8,230 |
| 9 | Indiana | $65,580 | $31.53 | 70 | +$5,200 |
| 10 | Maine | $64,640 | $31.08 | 150 | +$4,260 |
| 11 | Montana | $64,110 | $30.82 | 80 | +$3,730 |
| 12 | New Jersey | $63,850 | $30.70 | 40 | +$3,470 |
| 13 | Pennsylvania | $63,850 | $30.70 | 40 | +$3,470 |
| 14 | Virginia | $54,880 | $26.38 | 80 | −$5,500 |
| 15 | South Dakota | $56,660 | $27.24 | 120 | −$3,720 |
| 16 | Michigan | $57,100 | $27.45 | 90 | −$3,280 |
| 17 | West Virginia | $52,800 | $25.38 | 110 | −$7,580 |
| 18 | Missouri | $44,880 | $21.58 | 40 | −$15,500 |
| 19 | Arizona | $48,260 | $23.20 | 260 | −$12,120 |
| 20 | Florida | $31,010 | $14.91 | 700 | −$29,370 |
National median (reference): $60,380/year ($29.03/hour) · Total national employment: 6,290.
States Without Separately-Reported BLS Data
The BLS suppresses wage data for states where the game-warden workforce is too small to report reliably. This affects roughly 30 states — including Alabama, Alaska, Colorado, Illinois, Oregon, Texas, and others with active game-warden programs.
This does not mean those states have no game wardens. Texas, for example, employs a substantial force of game wardens through Texas Parks and Wildlife — but the BLS suppression threshold means no wage figure is published. For these states, we direct you to the official state wildlife agency career page, which often lists current salary ranges in job postings.
Our policy: We never estimate or infer a suppressed BLS figure. We report it as "Not separately reported in BLS OEWS May 2023" and link to the state agency. Browse all states — including those without BLS wage data — on our state directory, where each page lists the agency, requirements, academy, and how-to-become steps regardless of wage-data availability.
What Drives the State Pay Gap
The $58,000+ gap between the highest and lowest paying states reflects several factors:
- Cost of living. California, Washington, and New York have high costs of living that inflate nominal wages. Adjusted for purchasing power, the gap narrows substantially.
- State pay-scale structure. Each state's wildlife agency sets pay through civil-service bands or collective bargaining. States with strong public-employee unions (California, Minnesota, New York) tend to pay more.
- Federal vs. state employment mix. States with more federal game wardens (paid on the GS scale) may show different averages than states dominated by state-agency employment.
- Experience mix. States with senior workforces show higher averages; states with many recent academy graduates show lower averages.
For a pay-vs-cost-of-living analysis, see our best states for game wardens guide, which adjusts pay using BEA Regional Price Parities.
Frequently Asked Questions
Why isn't my state in the table?
The BLS suppresses wage data for states with small game-warden workforces to protect statistical reliability and confidentiality. Roughly 30 states have no separately-reported figure. Check your state's page at /state/[state]/ for the agency link, or see the state directory.
Which state pays game wardens the most? California at $89,020 mean annual wage (BLS May 2023). Minnesota ($88,280) and Washington ($82,320) follow.
Which state has the most game warden jobs? Florida with 700 officers (BLS May 2023), followed by New York (390) and Tennessee (370).
Is the salary data current? The most recent BLS OEWS release used is May 2023 (published 2024). BLS releases annual updates each spring. We refresh figures when new data is published.
Sources
- U.S. Bureau of Labor Statistics, OEWS May 2023, Fish and Game Wardens (SOC 33-3031): https://www.bls.gov/oes/2023/may/oes333031.htm
- BLS OEWS state wage map: https://www.bls.gov/oes/2023/may/333031sw.htm
- BLS copyright/attribution policy: https://www.bls.gov/bls/copyright.htm
Last updated June 2026. Disclaimer: Salary figures are compiled from public BLS data for informational purposes. States without separately-reported BLS data are honestly noted as such. Verify current pay with your state wildlife agency.